
La columna Campaign Activity Report module provides the analytics view of every campaign launched from the current node. It is divided into a main list page, where administrators select the campaign or campaigns they want to analyze, and a report panel that opens once a campaign is selected. Because the platform supports more than one campaign type, the report panel adapts its content to the type of campaign being inspected.
1. Main Page
The main page lists every campaign that has been created on the node and provides the entry point to their individual or combined reports.
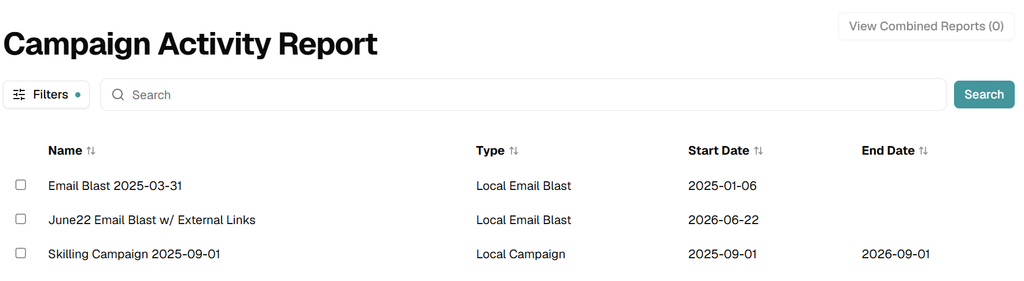
Layout
- Buscar bar — filters the list by campaign name.
- View Combined Reports (n) button (top right) opens a consolidated report that combines the metrics of the campaigns currently selected. The counter (n) reflects how many items are selected; the button stays disabled while no campaign is selected.
- List table with the following columns:
- Nombre — campaign name. Click the row to open its individual report.
- Tipo — type of campaign (for example, Local Campaign o Local Email Blast). The report panel displayed depends on this value.
- Fecha de Inicio — date when the campaign began.
- Fecha de Finalización — date when the campaign ended (empty if the campaign has no defined end date).
- Each column header includes a sort of icon that allows ascending or descending ordering.
Selecting Campaigns and Combining Reports
- Tick the checkbox on the left of each campaign you want to include in the consolidated report.
- La columna View Combined Reports (n) button activates and shows the number of selected items.
- Click the button to open the combined report.
Important: only campaigns of the same type can be combined. If campaigns of different types are selected (for example, a Local Campaign and a Local Email Blast), the platform shows the error message “Selected campaigns must have the same type.” Close the error with OK, adjust the selection so that every campaign shares the same type, and try again.
2. Opening a Campaign Report
Click any row in the list to open the report panel for that campaign. The panel header shows the campaign name and contains two tabs that are common for every campaign type:
- Campaign Dashboard — visual summary of the campaign performance.
- Campaign Details — record-level breakdown of every recipient.
The content of each tab depends on the type of the campaign, as described in the following sections.
3. Report Panel — Local Campaign
This panel is shown for campaigns of type Local Campaign. These campaigns send emails and link them to learning assignments, so the report tracks both the email funnel and the assignment lifecycle.
3.1 Campaign Dashboard
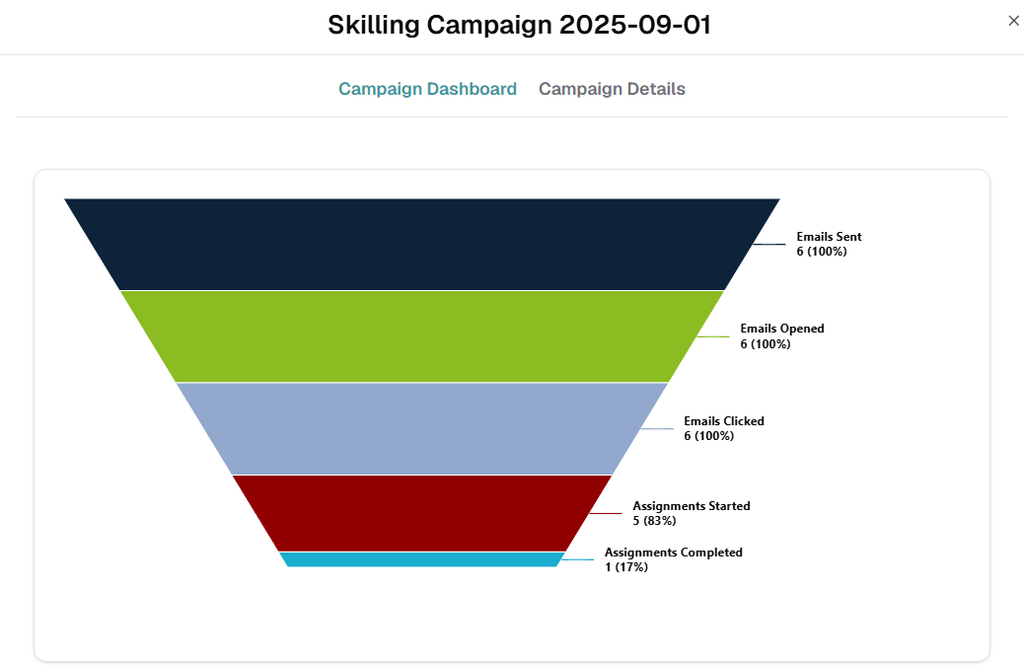
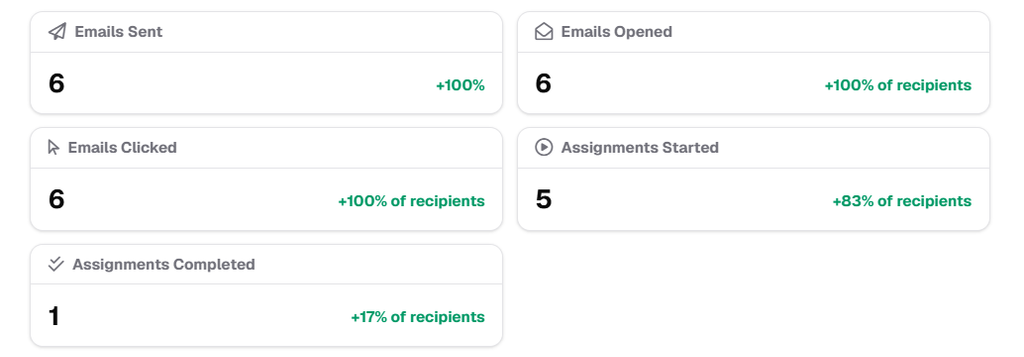
The dashboard displays a five-stage funnel chart followed by a set of metric cards.
Funnel stages (top to bottom):
- Emails Sent — total emails delivered as part of the campaign.
- Emails Opened — recipients who opened the email.
- Emails Clicked — recipients who clicked the call-to-action inside the email.
- Assignments Started — recipients who started the assigned learning content.
- Assignments Completed — recipients who finished the assigned learning content.
Every stage shows the absolute number and the percentage relative to Emails Sent, allowing administrators to identify where recipients drop off.
Metric cards (below the funnel) replicate each funnel stage as an individual KPI card with the absolute value and the percentage of recipients reached. The cards make it easy to copy a single metric without reading the chart.
3.2 Campaign Details
The Campaign Details tab lists every recipient of the campaign and the status of their assignment. It includes:
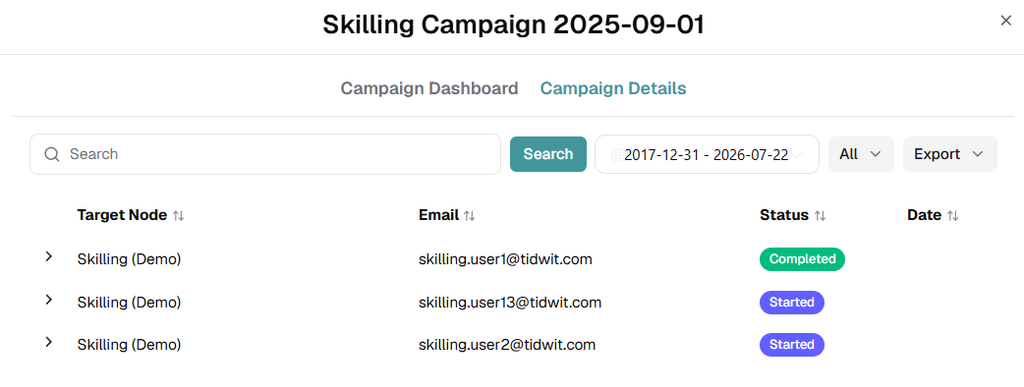
- Buscar field — filters by recipient email or target node.
- Date range picker — restricts the records to activity within the selected window.
- Estado dropdown (default All) filters by recipient status (Started, Completed, etc.).
- Export button — downloads the current view, including any applied filter, for offline analysis.
- Record counter — shows how many rows match the current filters (for example, 3 record(s) found).
The table has the following columns:
- Target Node — node where the recipient belongs.
- Correo Electrónico — recipient email address.
- Estado of the recipient in the campaign (Started, Completed, etc.).
- Date associated with the status.
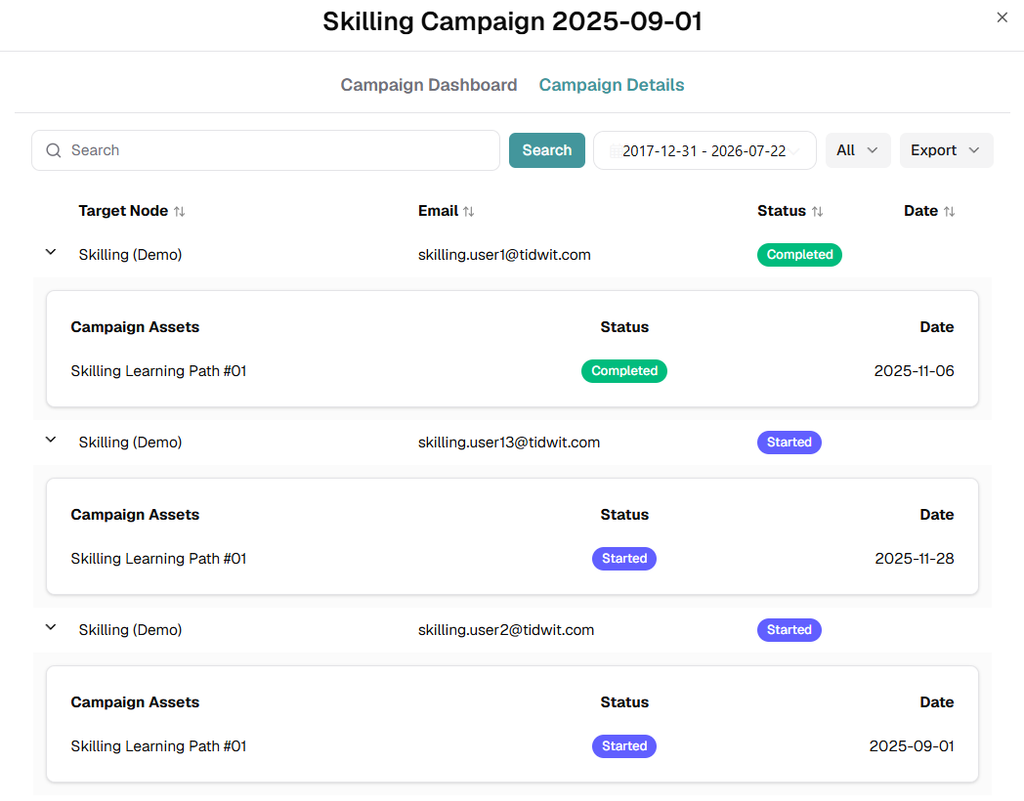
Each row is expandable. Clicking the arrow on the left reveals the Campaign Assets assigned to that recipient, with its own status and date, so administrators can drill down from recipient level to asset level without leaving the report.
4. Report Panel — Local Email Blast
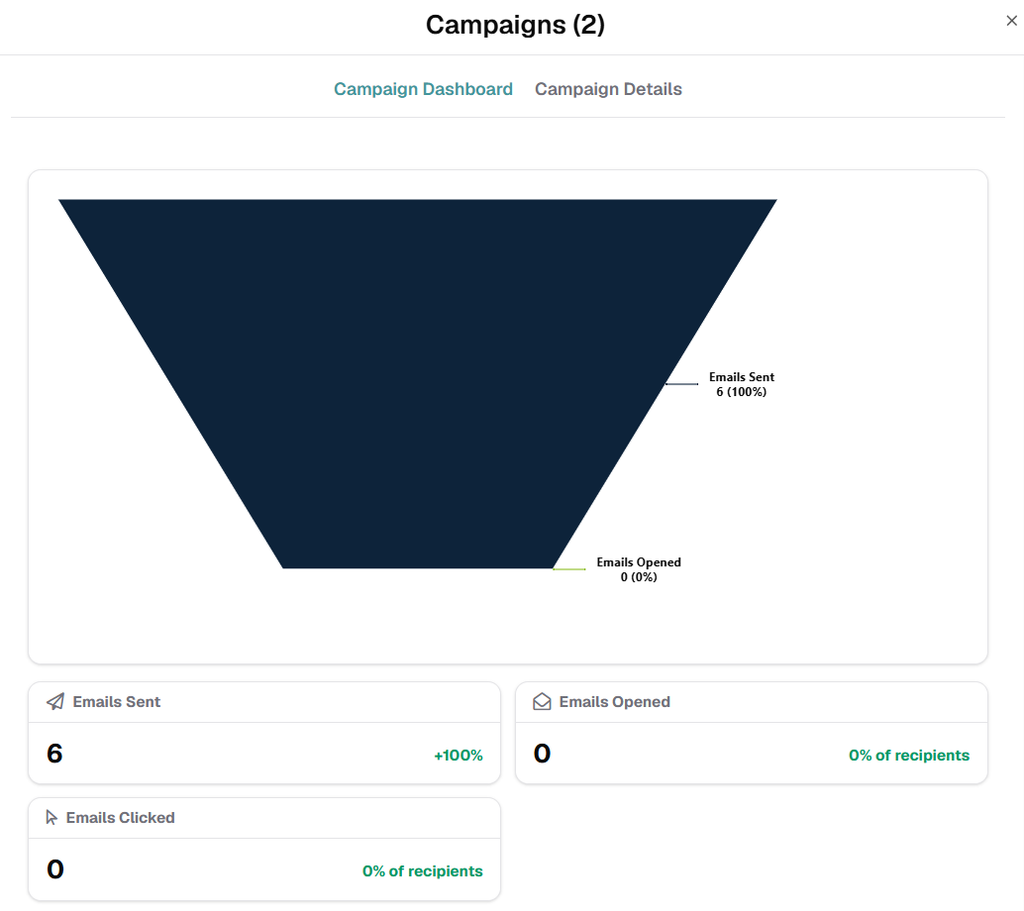
This panel is shown for campaigns of type Local Email Blast. Because email blasts are pure communication campaigns and do not deliver learning assignments, the dashboard and the detailed view contain only email-related metrics.
4.1 Campaign Dashboard
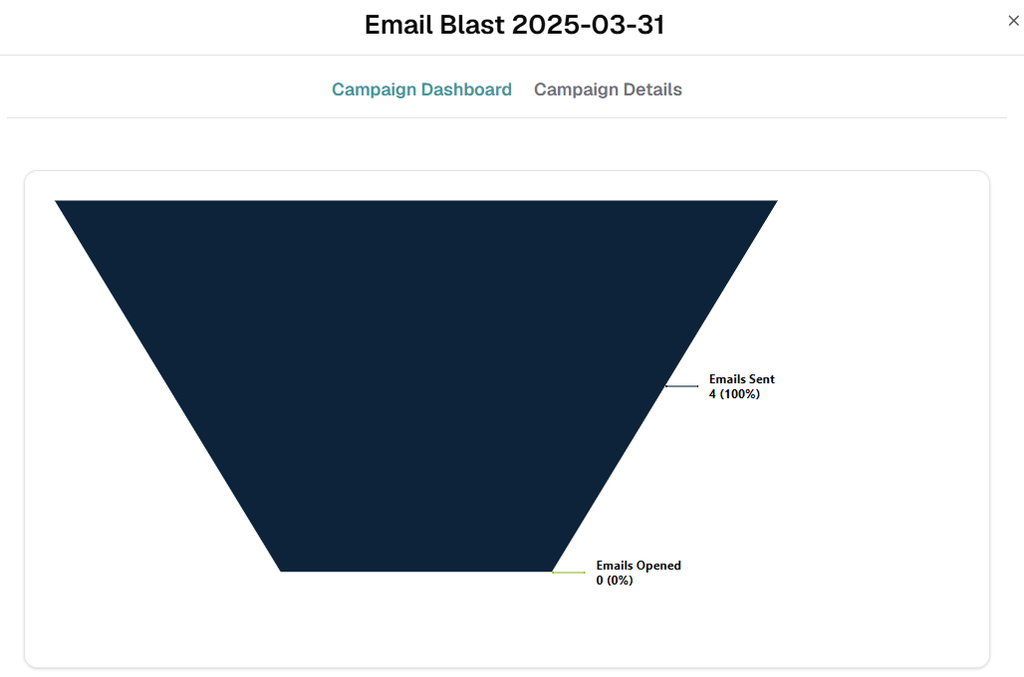
The dashboard displays a three-stage funnel and the matching set of metric cards.
Funnel stages:
- Emails Sent.
- Emails Opened.
- Emails Clicked.
The stages related to assignments (Assignments Started, Assignments Completed) are not shown for this campaign type. Each stage displays the absolute number and the percentage relative to Emails Sent.
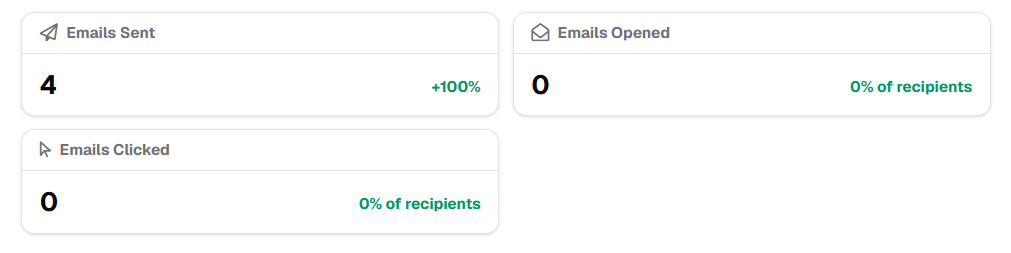
Metric cards — three cards, one per funnel stage, with the same values shown in the chart.
4.2 Campaign Details
The Campaign Details tab works the same way as for Local Campaign (Search, Date range, Status filter, Export, record counter) but the rows are not expandable, since there are no assignments attached to the email. The table contains the following columns:
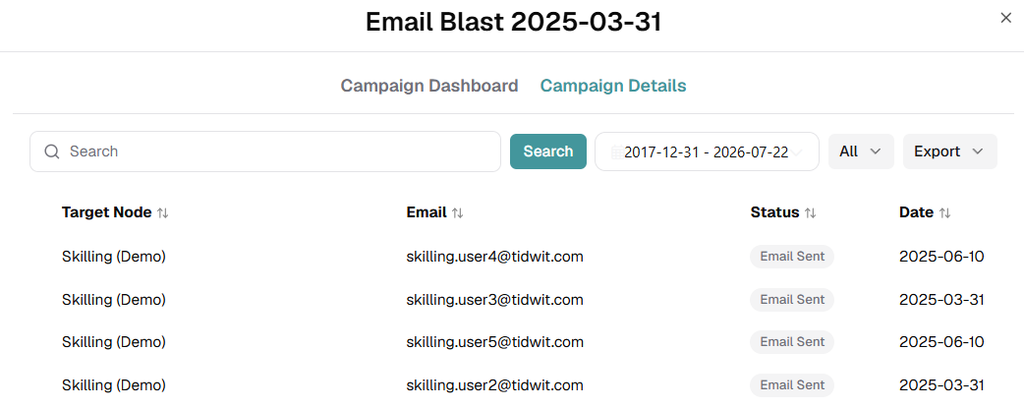
- Target Node.
- Correo Electrónico.
- Estado — Email Sent, Email Opened, or Email Clicked.
- Date associated with the status.
Export
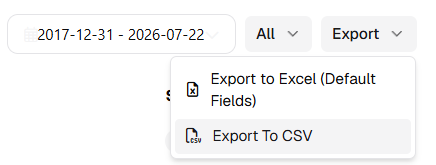
- La columna Export button is available on the Campaign Details tab for every campaign type and respects the currently applied filters.
- La columna Date range filter on Campaign Details controls only the records shown in that tab; it does not affect the funnel and KPIs on the Campaign Dashboard.
- The funnel and metric cards refresh automatically as new emails are sent and as recipients interact with the campaign; there is no need to manually reload the page.
- When generating a combined report from multiple campaigns of the same type, the metrics shown are the aggregated values across every selected campaign, using the same dashboard layout described above.