To navigate to the Event Dashboard of a specific event from the Events And Webinars main page, click on the three dots button of the event whose dashboard you want to see and select Activity Report.
Once you are in the Dashboard, you will see a panel and a graphic with different metrics.
In the upper right corner you can modify the dates on which the report will be generated.
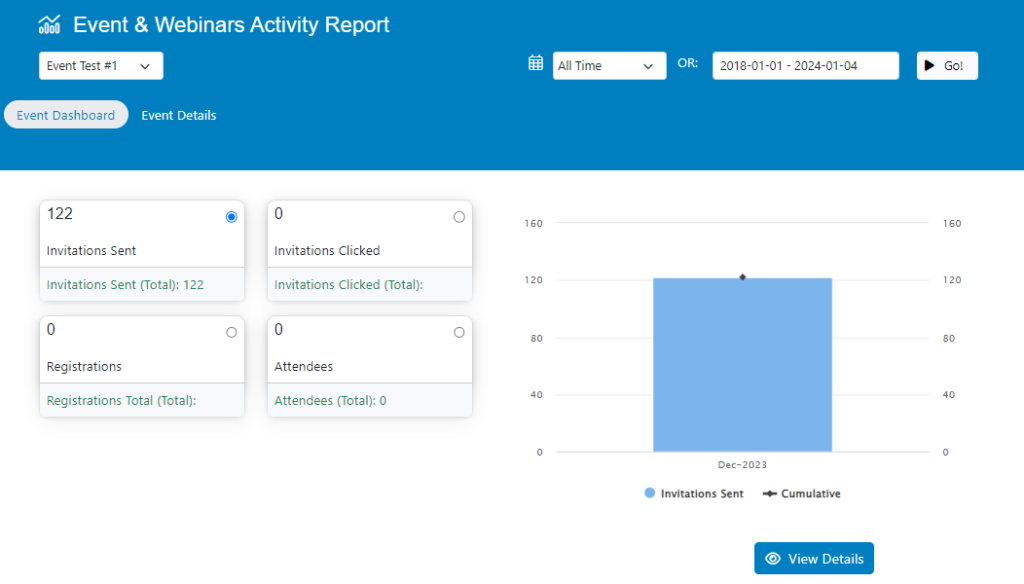
These statistics are:
- The total number of Invitations Sent to which the event was sent
- The total number of Invitations Clicked of the current event
- The total number of Registrations for the current event
- The total number of Attendees at the event.
Below the graphic you will see the View Details section to find advanced information from the current event.
Event Details
You will be able to view the history of invitations sent to users to participate in the event.
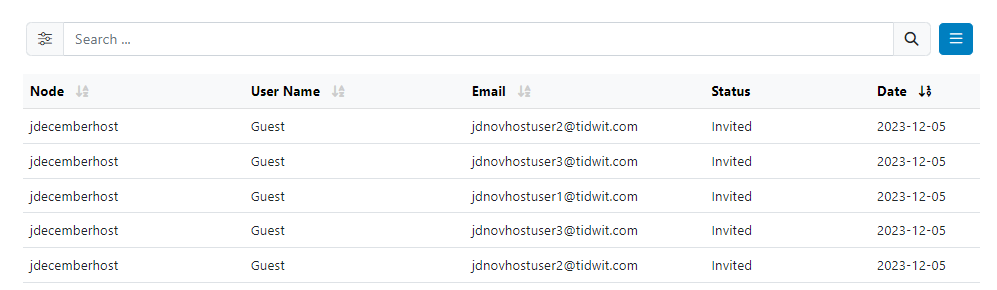
You can use the Search Bar to find specific information.
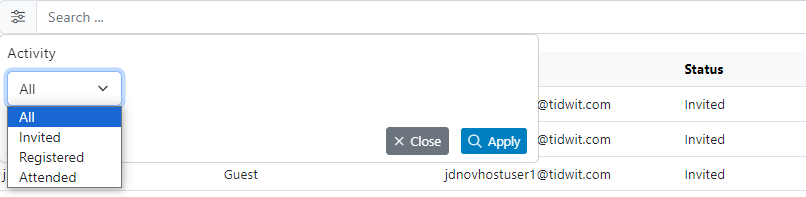
You can use the filters to sort the information in the table.

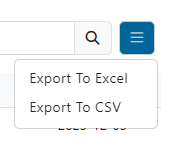
You can export the information in Excel and CSV format.