On this tab, you will see different grouped learning reports which you can navigate through and view details about the different assets.
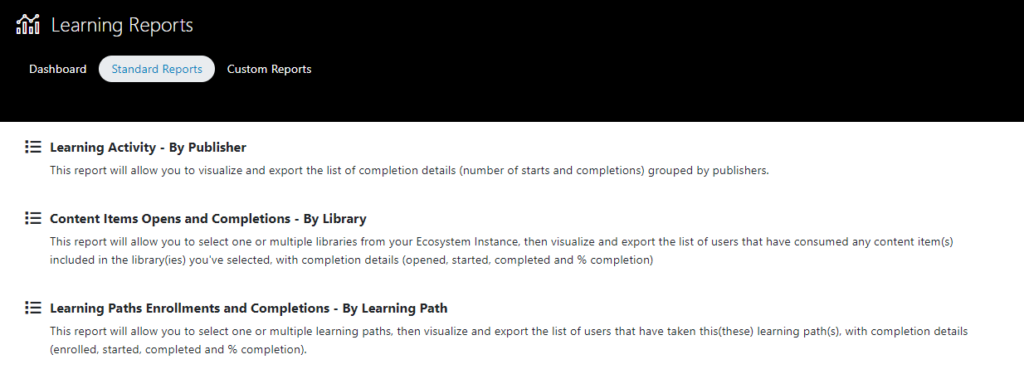
Learning Activity – By Publisher
This report will allow you to visualize and export the list of completion details (number of starts and completions) grouped by publishers.
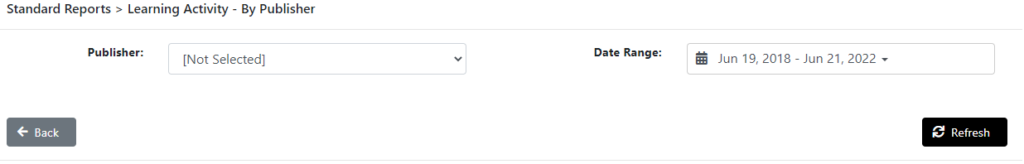
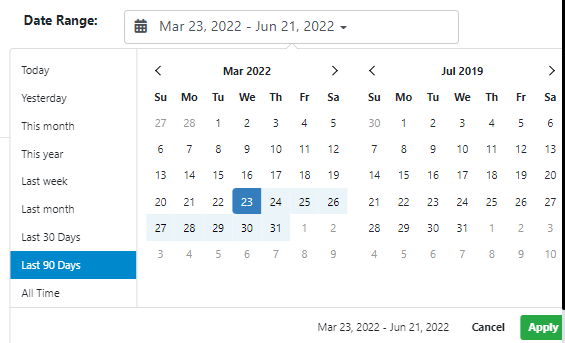
Select the publisher and a date range. After selecting the desired date range, click on Apply.
Click on Refresh to apply the filter.
A new table with the new information will appear.
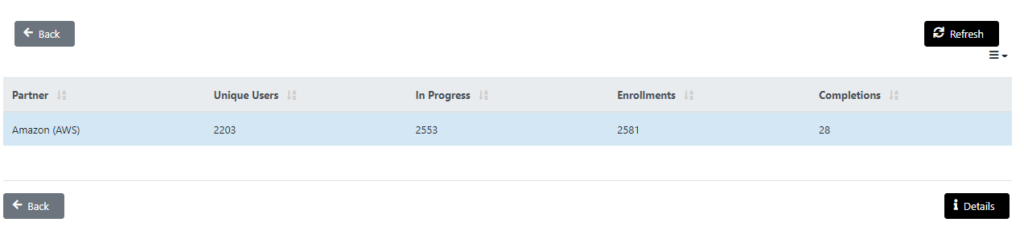
On that table, you will see:
- Partner’s Name.
- Number of Unique Users.
- Number of partner’s assets currently In Progress.
- Number of partner’s assets Enrollments.
- Number of partner’s assets Completions.
Click on the report you’d like to see and a Details button will appear. Click on it to see a list of all the users that have started or completed a Learning Path of the selected partner.
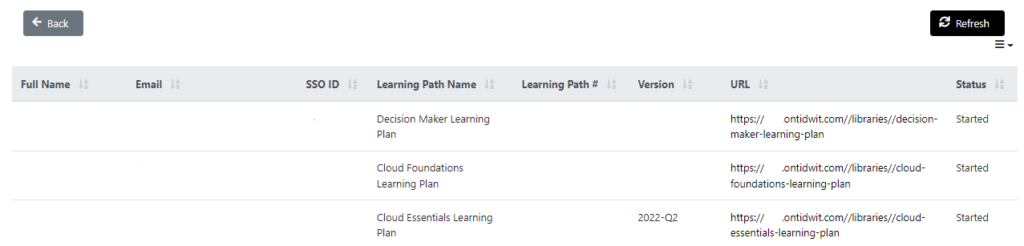
This list shows:
- User’s Full Name.
- User’s Email.
- User’s SSOID.
- The started or completed Learning Path Name.
- The started or completed Learning Path #.
- The Learning Path’s version.
- The Learning Path’s URL.
- The Learning Path’s Status (Started or Completed).
If you want to export this data, click on the menu button under the Refresh button. Then, you can select if you want to export data in an Excel file or in CSV format.
Content Item Opens and Completions – By Library
This report will allow you to select one or multiple libraries from your Ecosystem Node, then visualize and export the list of users that have consumed any content item(s) included in the library(ies) you’ve selected, with completion details (opened, started, completed and % completion).
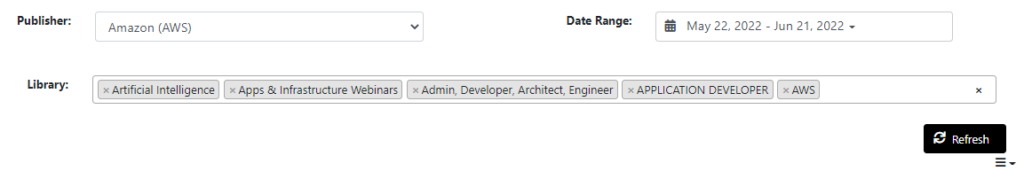
Select the Publisher, the Date Range and the Library(ies) that will be included on the search. Click on Refresh.
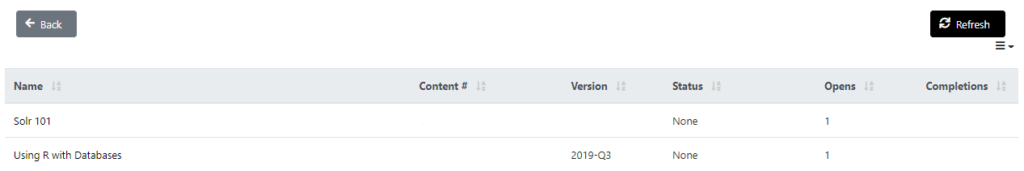
A new table will appear.
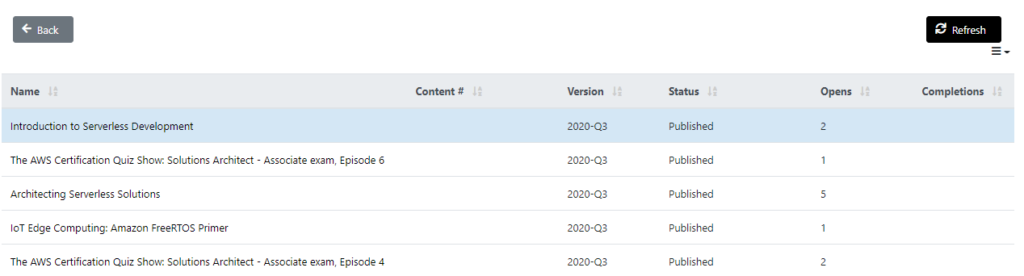
On that table, you can see:
- The Content Item’s Name.
- The content number.
- The content Version.
- The Content Item’s Status.
- The number of Content Item Opens.
- The number of Content Item Completions.
- You can click on the Content Item’s name to open its page in a new tab.
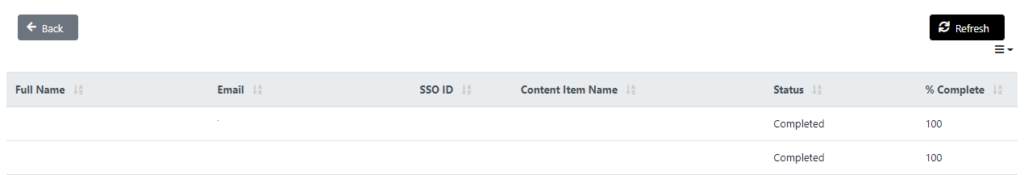
Click on the report you’d like to see and a Details button will appear below the table. Click on it to see a list of all the users that have started or completed that Content Item.
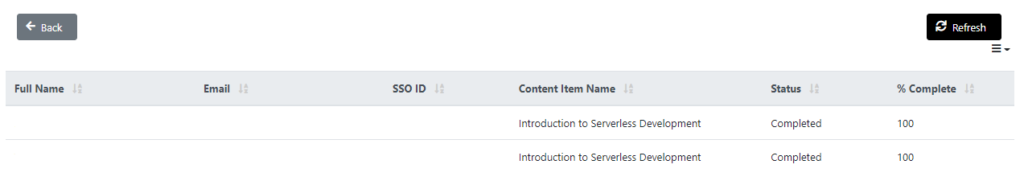
On the list, you will see:
- User’s Full Name.
- User’s Email.
- User’s SSOID.
- The started or completed Content Item.
- The Content Item’s Status (Started or Completed).
- The completion percentage of the Content Item.
If you want to export this data, click on the menu button under the Refresh button. Then, you can select if you want to export data in an Excel file or in CSV format.
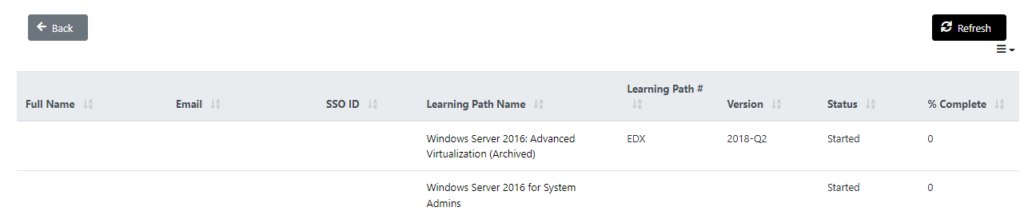
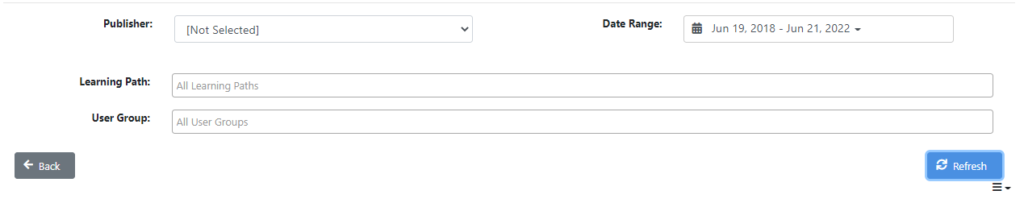
Learning Paths Enrollments and Completions – By Learning Path
This report will allow you to select one or multiple learning paths, then visualize and export the list of users that have taken this(these) learning path(s), with completion details (enrolled, started, completed and % completion).
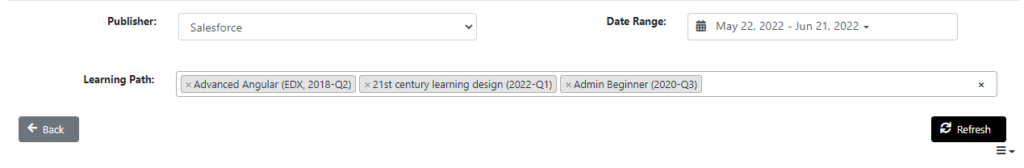
Select the Publisher, Date Range and the Learning Path(s) that will be included on the search. Then, click on Refresh.
A new table will appear.
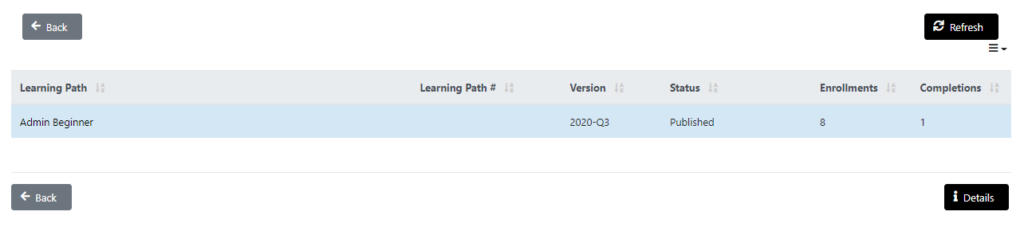
On that table, you will see:
- Learning Path’s Name.
- Learning Path number.
- Learning Path’s Version.
- Learning Path’s Status.
- Number of Learning Path enrollments.
- Number of Learning Path completions.
- You can click on the Learning Path’s name to open its page in a new tab.
Click on the report you’d like to see and a Details button will appear below the table. Click on it to see a list of all the users that have started or completed that Content Item.
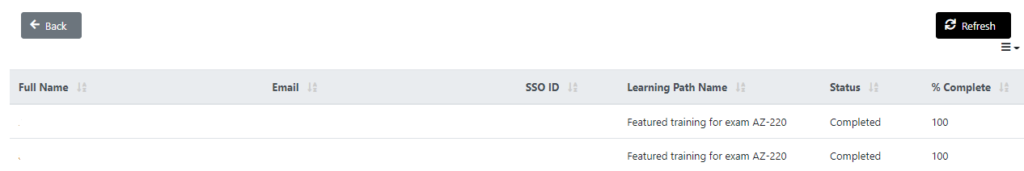
On the list, you will see:
- User’s Full Name.
- User’s Email.
- User’s SSOID.
- The started or completed Learning Path.
- The Learning Path’s Status (Started or Completed).
- The completion percentage of the Content Item.
If you want to export this data, click on the menu button under the Refresh button. Then, you can select if you want to export data in an Excel file or in CSV format.
Learning Path Enrollments and Completions – By User
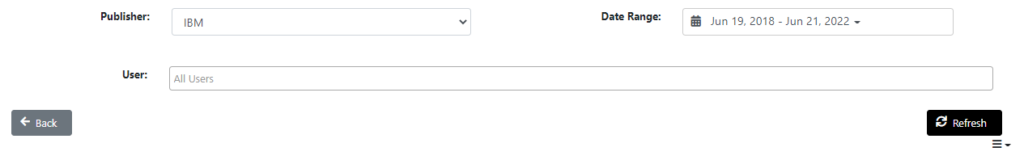
This report will allow you to select on or multiple users, then visualize and export the corresponding learning path(s) completion details (enrolled, started, completed and % completion).
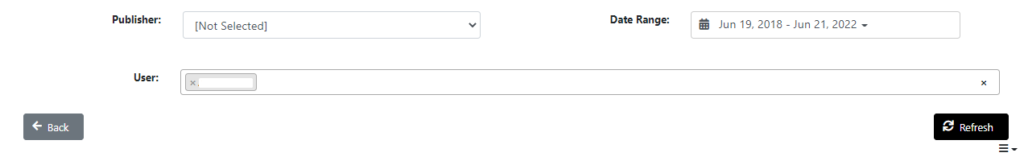
Select the Publisher, Date Range and the User you want to know more about. Then, click on Refresh.
A new table will appear.
On that table, you will see:
- User’s Full Name.
- User’s Email.
- User’s SSOID.
- The started or completed Learning Path.
- The Learning Path’s number.
- The Learning Path’s version.
- The Learning Path’s Status (Started or Completed).
- The completion percentage of the Learning Path.
- You can click on the Learning Path’s name to open its page in a new tab.
If you want to export this data, click on the menu button under the Refresh button. Then, you can select if you want to export data in an Excel file or in CSV format.
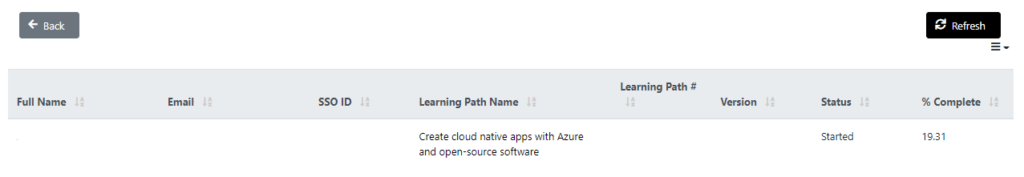
Learning Paths Enrollments and Completions – By User Group
This report will allow you to select one or multiple user groups, then visualize and export the corresponding learning path(s) completion details (enrolled, started, completed and % completion).
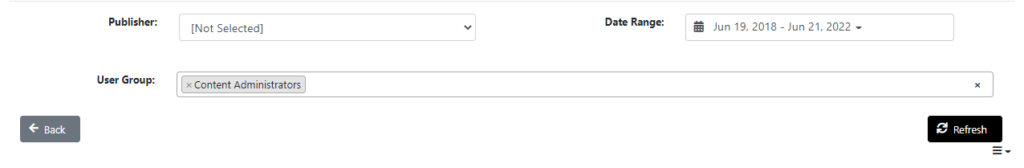
Select the Publisher, Date Range and the User Group. Then, click on Refresh.
A new table will appear.
On that table, you will see:
- User’s Full Name.
- User’s Email.
- User’s SSOID.
- The started or completed Learning Path.
- The Learning Path’s number.
- The Learning Path’s version.
- The Learning Path’s Status (Started or Completed).
- The completion percentage of the Learning Path.
- You can click on the Learning Path’s name to open its page in a new tab.
If you want to export this data, click on the menu button under the Refresh button. Then, you can select if you want to export data in an Excel file or in CSV format.
Content Items Opens and Completions – By Learning Path
This report will allow you to select one or multiple learning paths from your Ecosystem Node, then visualize and export the list of users that have consumed any content item(s) included in the learning path(s) you’ve selected, with completion details (opened, started, completed and % completion).
Select the Publisher, Date Range, Learning Path and User Group. Then, click on Refresh.
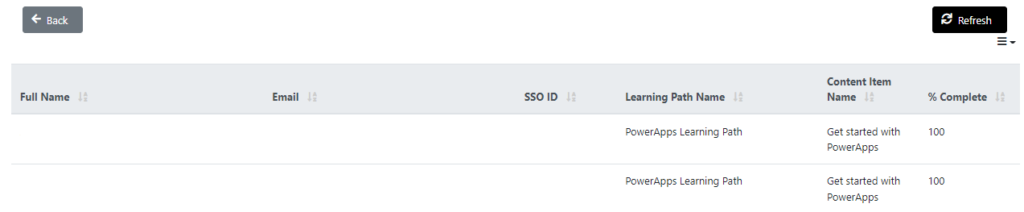
A new table will appear.
On that table, you will see:
- User’s Full Name.
- User’s Email.
- User’s SSOID.
- The started or completed Content Item.
- The Content Item’s Status (Started or Completed).
- The completion percentage of the Content Item.
- You can click on the Content Item’s name to open its page in a new tab.
If you want to export this data, click on the menu button under the Refresh button. Then, you can select if you want to export data in an Excel file or in CSV format.
Learning Paths & Content Item Completions – By User
This report will allow you to select one or multiple users, then visualize and export the corresponding learning path(s) and content item completion details.
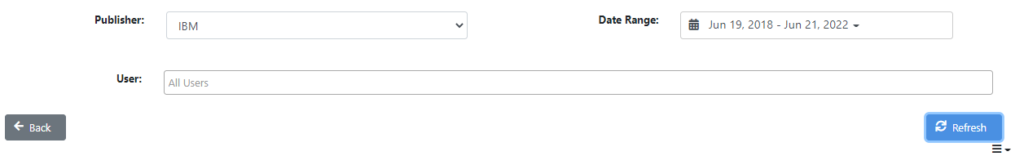
Select the Publisher, Date Range and User. Then, click on Refresh.
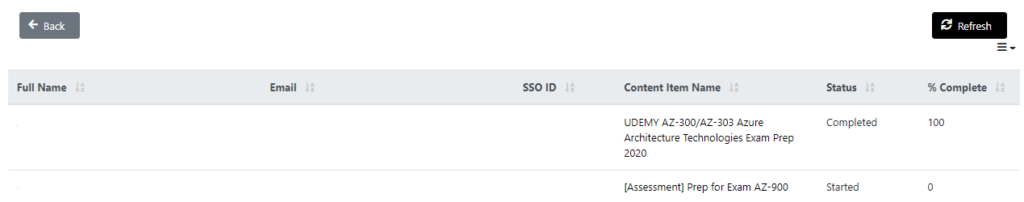
A new table will appear.
On that table, you will see:
- User’s Full Name.
- User’s Email.
- User’s SSOID.
- The completed Learning Path.
- The completed Content Item.
- The completion percentage of the Learning Path.
If you want to export this data, click on the menu button under the Refresh button. Then, you can select if you want to export data in an Excel file or in CSV format.
Content Items Opens and Completions – By Content
This report will allow you to select one or multiple content items, then visualize and export the list of users that have taken this(these) content item(s), with completion details (accessed, opened, completed and % completion).
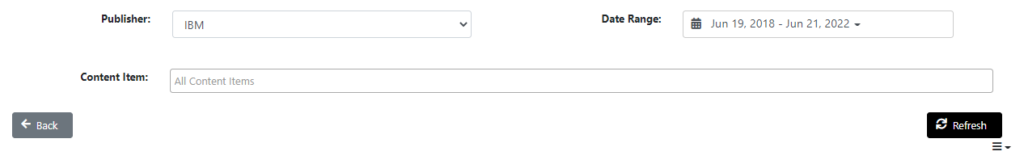
Select the Publisher, Date Range and the Content Item. Then, click on Refresh.
A new table will appear.
On that table, you can see:
- The Content Item’s Name.
- The content number.
- The content Version.
- The Content Item’s Status.
- The number of Content Item Opens.
- The number of Content Item Completions.
- You can click on the Content Item’s name to open its page in a new tab.
Click on the report you’d like to see and a Details button will appear below the table. Click on it to see a list of all the users that have started or completed that Content Item.

On the list, you will see:
- User’s Full Name.
- User’s Email.
- User’s SSOID.
- The started or completed Content Item.
- The Content Item’s Status (Started or Completed).
- The completion percentage of the Content Item.
If you want to export this data, click on the menu button under the Refresh button. Then, you can select if you want to export data in an Excel file or in CSV format.
Content Items Opens and Completions – By User
This report will allow you to select on or multiple users, then visualize and export the corresponding content items(s) completion details (accessed, opened, completed and % completion).
Select the Publisher, Date Range and User. Then, click on Refresh.
A new table will appear.

On that table, you will see:
- User’s Full Name.
- User’s Email.
- User’s SSOID.
- The started or completed Content Item.
- The Content Item’s Status (Opened, Started, Completed, Passed, Timed Out, Failed).
- The completion percentage of the Content Item.
- You can click on the Content Item’s name to open its page in a new tab.
If you want to export this data, click on the menu button under the Refresh button. Then, you can select if you want to export data in an Excel file or in CSV format.
Content Items Opens and Completions – By User Group
This report will allow you to select one or multiple user groups, then visualize and export the corresponding content items(s) completion details (accessed, opened, completed and % completion).

Select the Publisher, Date Range and User Group. Then, click on Refresh.
A new table will appear.
On that table, you will see:
- User’s Full Name.
- User’s Email.
- User’s SSOID.
- The started or completed Content Item.
- The Content Item’s Status (Opened, Started, Completed, Passed, Timed Out, Failed).
- The completion percentage of the Content Item.
- You can click on the Content Item’s name to open its page in a new tab.
If you want to export this data, click on the menu button under the Refresh button. Then, you can select if you want to export data in an Excel file or in CSV format.
Assessment Scores – By Assessment
This report will allow you to select one or multiple assessments, then visualize and export the list of users that have taken this(these) assessment(s), with assessment status (pass/fail) and score (%).
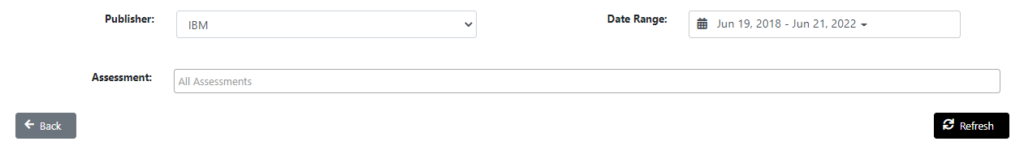
Select the Publisher, Date Range and the Assessment. Then, click on Refresh.
A new table will appear.
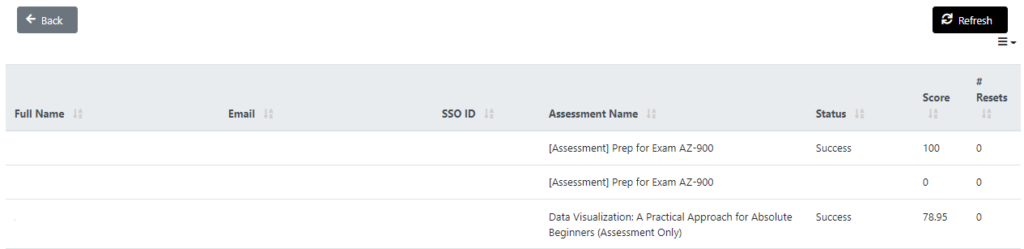
On that table, you will see:
- User’s Full Name.
- User’s Email.
- User’s SSOID.
- Assessment’s Name.
- Assessment’s Status (Success or Failure).
- Assessment’s Score.
- Assessment’s number of resets.
If you want to export this data, click on the menu button under the Refresh button. Then, you can select if you want to export data in an Excel file or in CSV format.
Assessment Scores – By User
This report will allow you to select on or multiple users, then visualize and export the corresponding assessment(s) status (pass/fail) and score (%).
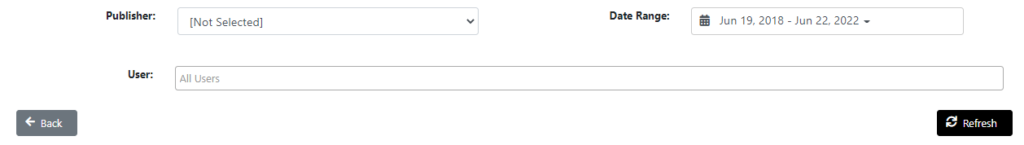
Select the Publisher, Date Range and User. Then, click on Refresh.
A new table will appear.

On that table, you will see:
- User’s Full Name.
- User’s Email.
- User’s SSOID.
- Assessment’s Name.
- Assessment’s Status (Success or Failure).
- Assessment’s Score.
- Assessment’s number of resets.
If you want to export this data, click on the menu button under the Refresh button. Then, you can select if you want to export data in an Excel file or in CSV format.
Assessment Scores – By User Group
This report will allow you to select one or multiple user groups, then visualize and export the corresponding assessment(s) status (pass/fail) and score (%).

Select the Publisher, Date Range and User Group. Then, click on Refresh.
A new table will appear.

On that table, you will see:
- User’s Full Name.
- User’s Email.
- User’s SSOID.
- Assessment’s Name.
- Assessment’s Status (Success or Failure).
- Assessment’s Score.
- Assessment’s number of resets.
If you want to export this data, click on the menu button under the Refresh button. Then, you can select if you want to export data in an Excel file or in CSV format.
Assessment Scores – By Learning Path
This report will allow you to select one or multiple learning paths, then visualize and export the list of users that have taken the corresponding assessment(s), with assessment status (pass/fail) and score (%).
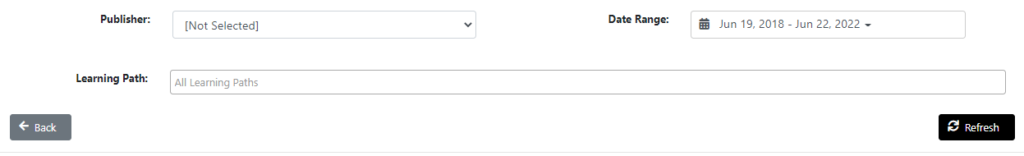
Select the Publisher, Date Range and Learning Path. Then, click on Refresh.
A new table will appear:
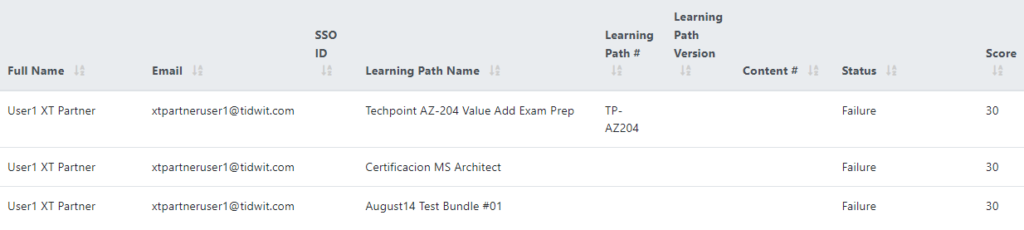
On that table, you will see:
- User’s Full Name.
- User’s Email.
- User’s SSOID.
- Learning Path’s Name.
- Learning Path Number.
- Learning Path Version.
- The Content Number.
- Status.
- Score.
If you want to export this data, click on the menu button under the Refresh button. Then, you can select if you want to export data in an Excel file or in CSV format.