Filters
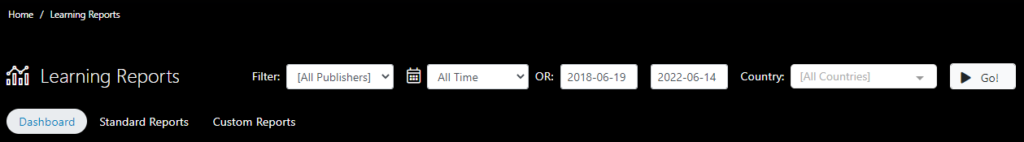
This is the first tab you will see. Above the three tabs you will see a filtering tool. Use it to filter and search for reporting metrics by selecting:
• Publisher.
• Period of time (select it form the dropdown menu or select the date range in which you want to search).
• Select the country if needed.
• Click on Go!
The filters will be applied to the reports content below the Ecosystem Tree. Each time you make a change on the filters click on the Go! Button to update the information shown below.
All Reports Tab
By default, All Reports are showing, and you can scroll up and down in the page to look across each section. However, if you know what you are looking for, you may also jump directly to the relevant section by clicking the corresponding “tab” on top of the page (Platform Engagement, Geography Report, Content Report, and/or Learning Report).

Platform Engagement Tab
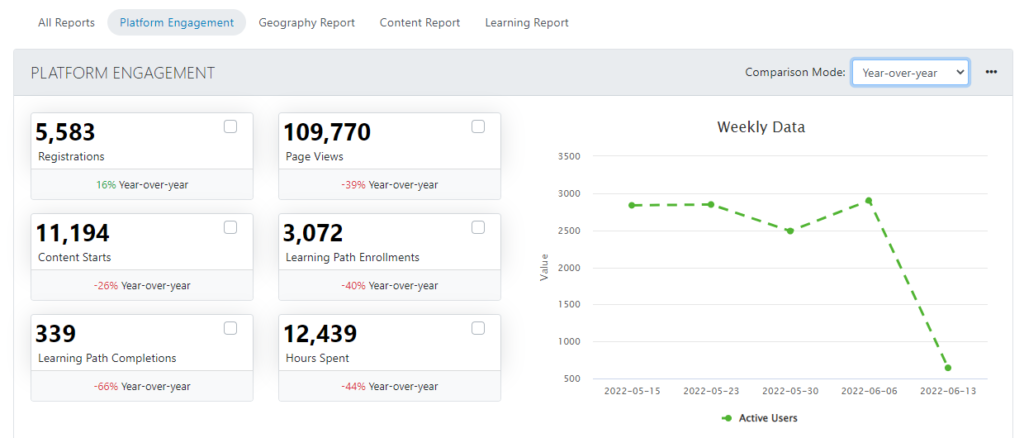
On the left, this section shows the metrics for the numbers of Registrations, Page Views, Content Starts, Learning Path Enrollments, Learning Path Completions and Hours Spent. Below the numbers, you can see the percentage they represent depending on the selected Comparison Mode, which you can change in the dropdown menu on the top right corner of the Platform Engagement section.
On the right part of this section, you will see a graphic that shows the platform active users across time. Active users are based on the number of Unique User Logins during a given week or month. The graphic will show monthly or weekly data, depending on the time range selected from the top filters (if your time range is less than 3 months, then the chart will show weekly metrics. If your time range is greater than 3 months, then the chart will show monthly metrics).
You will see a “three dots” button on the top right corner next to the Comparison Mode menu. Click on it and three new options will be displayed.
Click on View Raw Data and a pop-up window will appear showing a table with all the selected information.
Click on Export To Excel to download all the data in an excel file.
Geography Report Tab
The next section is the Geography Report. On the filter above the graphics, you will be able to filter metrics by Active Users, Registrations, Content Starts and Learning Path Enrollments and by country.
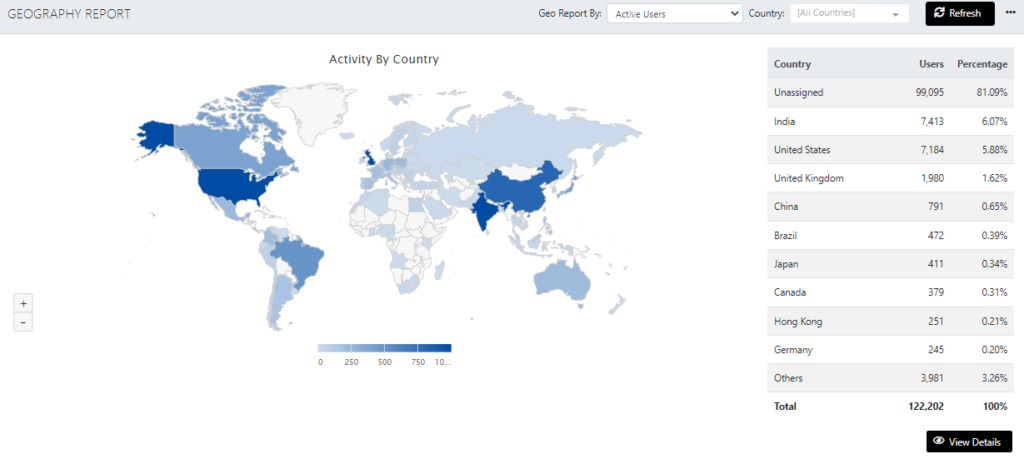
Below the filters on the left side, you will see the geographical map. You can hover the mouse pointer over the map and visualize the information for each country displayed on a floating table. On the right side you can see a table presenting the selected metric(s) and country(ies) and their percentage.
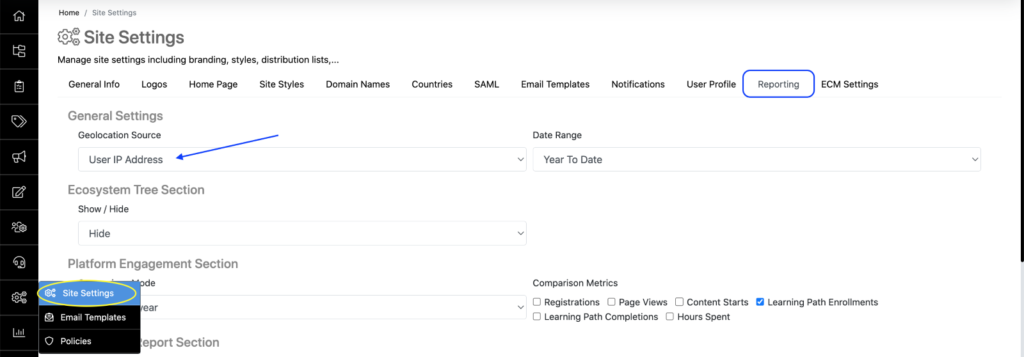
User country location is either based on the User IP address or on the User profile field. You can define which location method (IP-based or Profile-based) you want to report in the Geography section by changing the “Reporting Settings” (under Site Settings) – as per below:
When you see “Unassigned” in the Geography report, it means that the system was not able to figure out where the User is coming from (for example, if the location method is IP-based, the system may not be able to locate users who are using a Corporate Proxy or a VPN). Salto de página
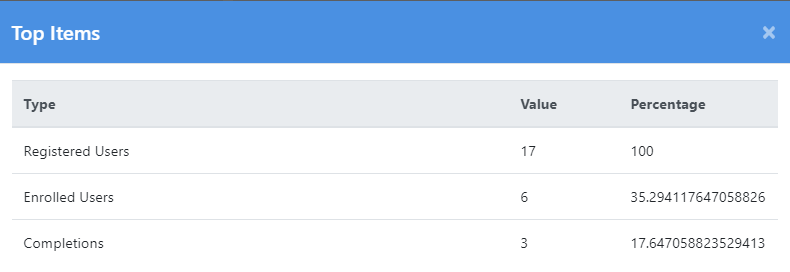
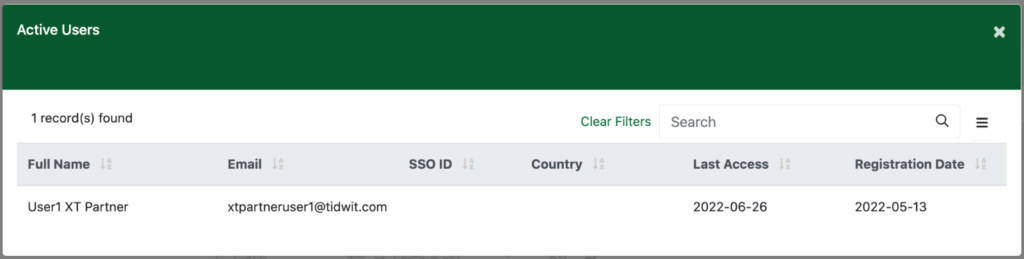
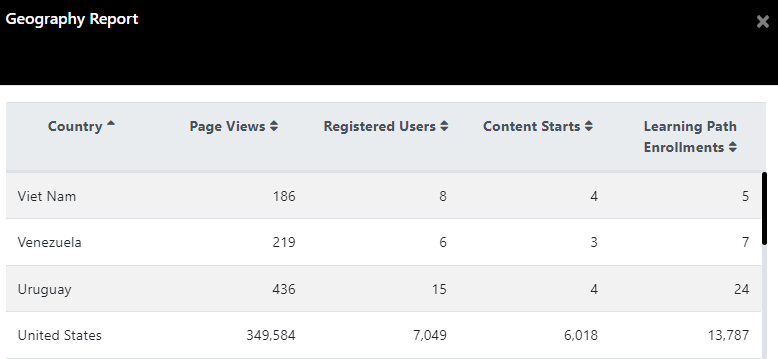
On the bottom right corner of this section, you will see a View Details button. Click on it to see a pop-up table with detailed info for each selected metric:
Active Users/Registrations
If you selected Active Users or Registrations, you will see their Full Name, Email, SSO ID, Country, Last Access date and Registration Date. You can also search for specific users using the Search Bar. Click on the menu button to export the data in an Excel or CSV format file.
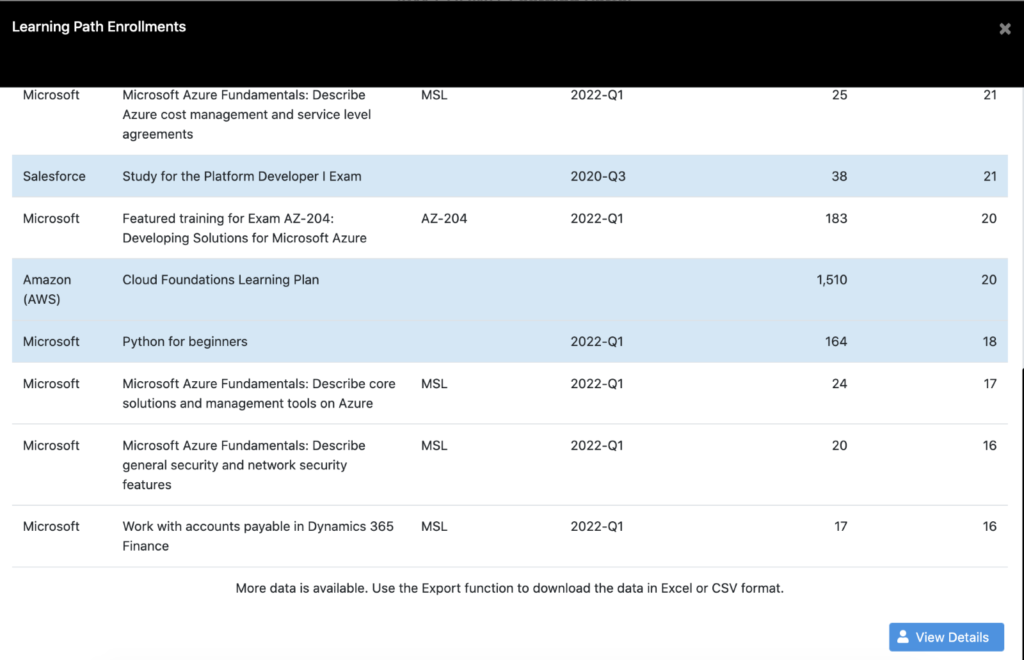
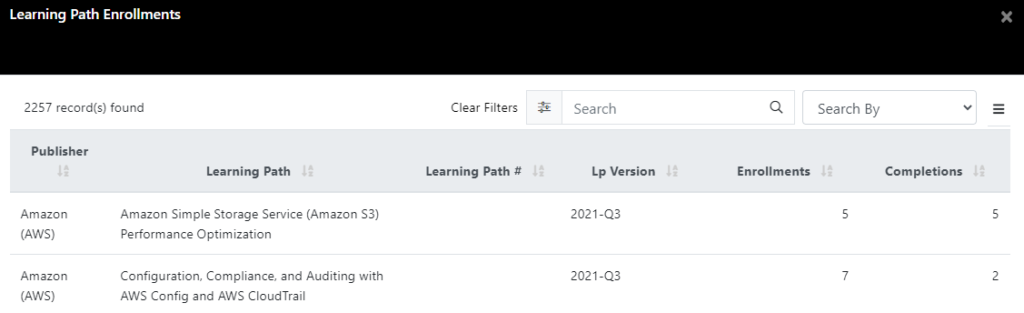
Learning Path Enrollments
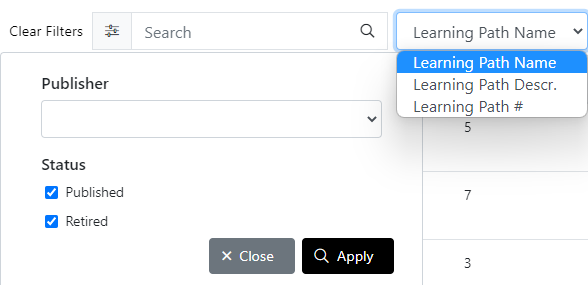
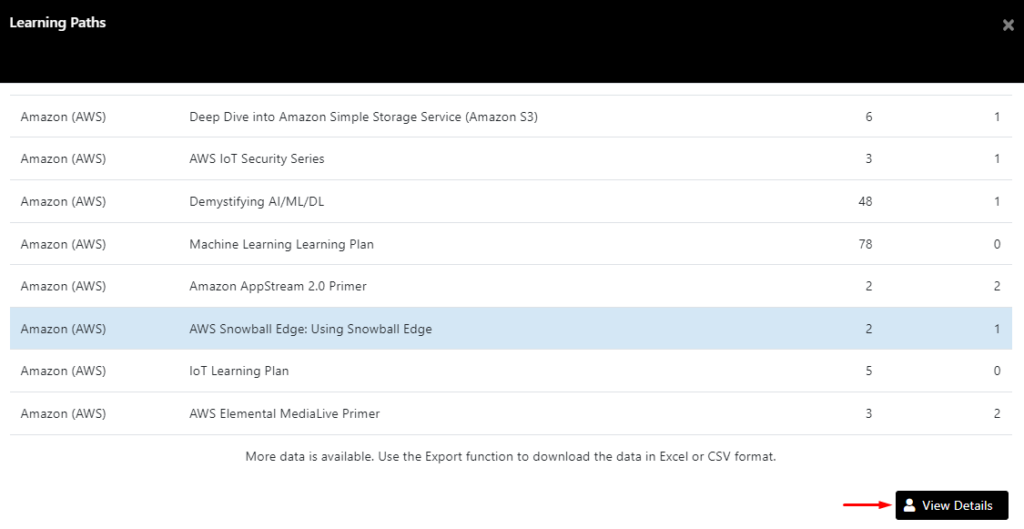
Learning Path enrollments will tell you which Learning Paths have been enrolled across the selected Countries. Use the Up and Down arrows next to each column to sort them as required.
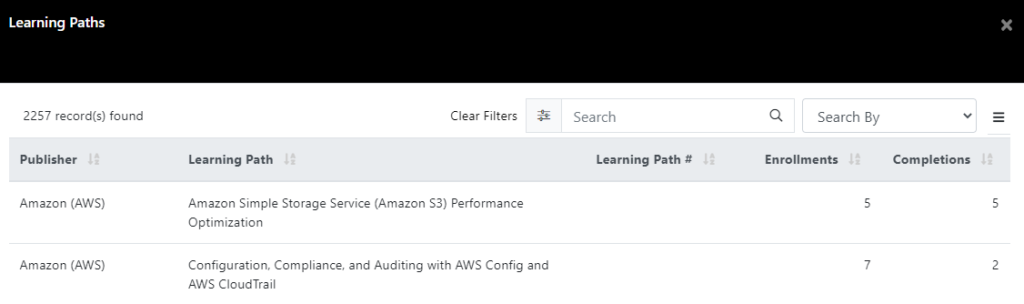
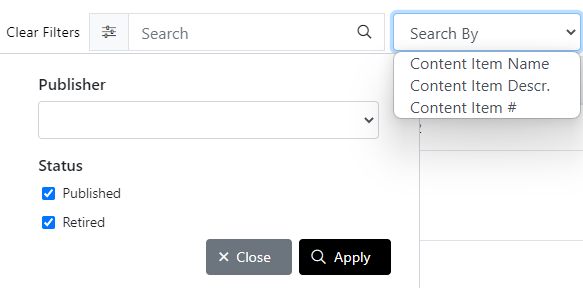
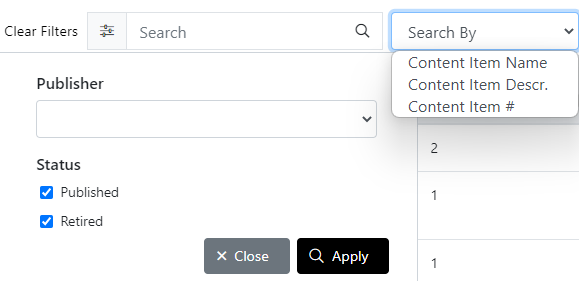
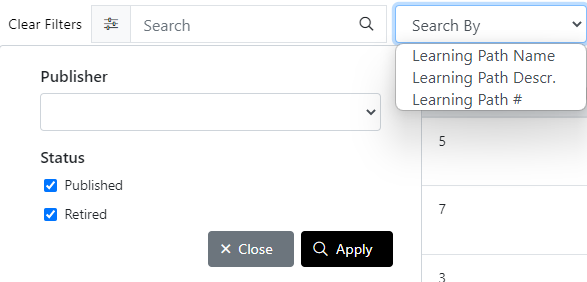
Go to the filter to search for Learning Paths with specific information like Publisher, Status or Name, Description or Number. Click on the menu button to export the data in an Excel or CSV format file.
You can then select one or multiple Learning Path(s) (by holding the Ctrl key on your keyboard) and click the View Details button on the bottom right corner of the window to show the list of users who’ve enrolled the selected Learning Paths.
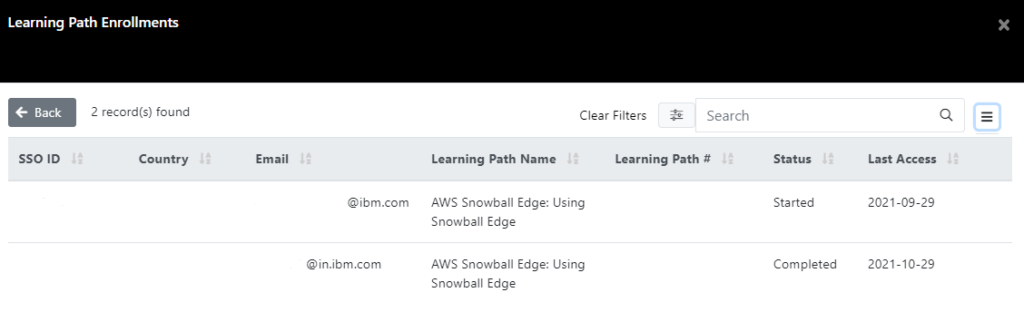
A new table will be opened showing the users that started/completed the selected Learning Path(s).
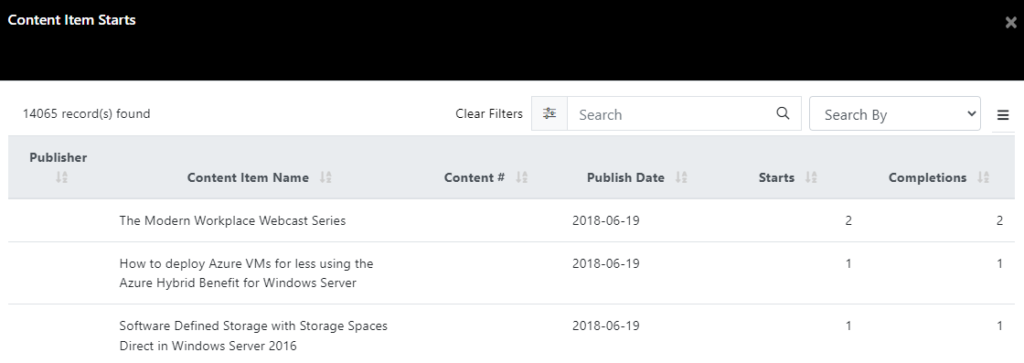
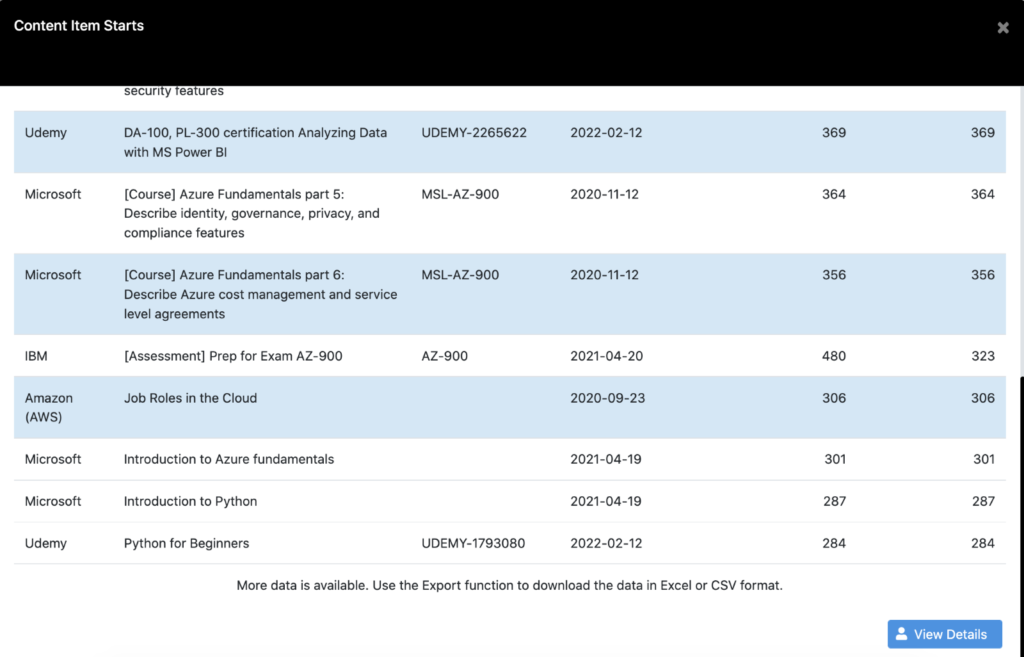
Content Starts
If you selected Content Starts, on the table you will see the content’s Publisher, Name, Number, Publish Date, Starts and Completions.
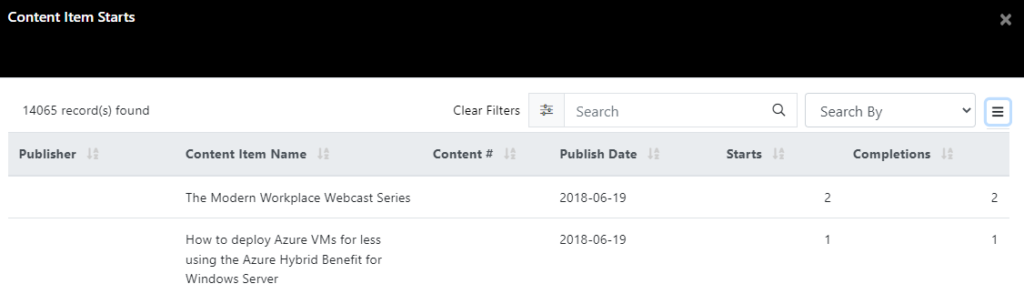
Go to the filter to search for Content Items with specific information like Publisher, Status or Name, Description or Number. Click on the menu button to export the data in an Excel or CSV format file.
Similar to the Learning Paths, you can select one or multiple Content Item(s) and click the View Details button on the bottom right corner of the window to view user-level engagement details.
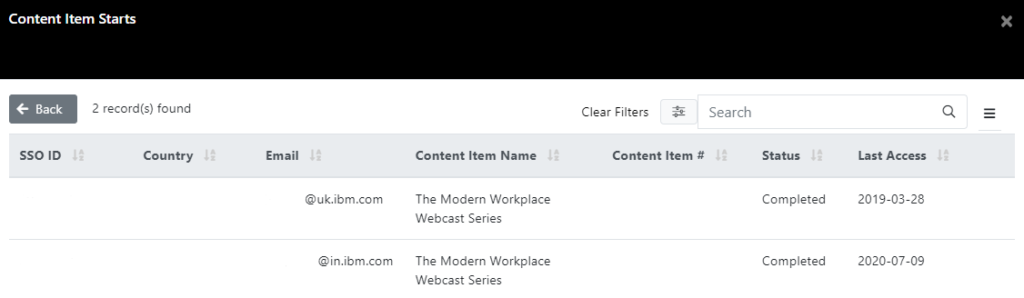
A new table will be opened showing the users that started/completed the selected Content Item.
Close the pop-up window when you are finished viewing the reports.
You will see a “three dots” button on the top right corner Geography Report section. Click on it and three new options will be displayed.
Click on View Raw Data and a pop-up window will appear showing a table with all the selected information.
Click on Export To Excel to download all the data in an excel file.
Click on Export To CSV to download all the data in CSV format.
Content Report Tab
In this section, you can see the Content Starts by publisher and the Content Starts by type. Select a specific value from the Asset Type drop-down if you want to only report on a specific type of content like videos, self-paced courses, webinars, documents etc.
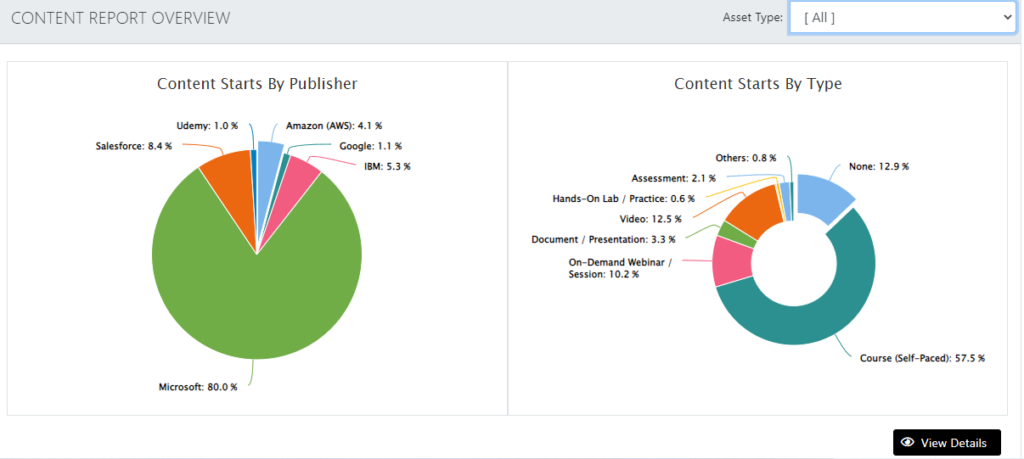
Hover the mouse pointer over the graphics to see the total amount of Content Starts for each publisher and each type.
Click on the View Details button to open a new table that shows all Content Items with their Starts and Completions.
You can use the filters to search content by Publisher, Status or Content Item’s Name, Description or Number. Click on the menu button next to the filter to export the data in an Excel or CSV format file.
Similar to the Geography section, you can then select one or multiple rows from the table (by holding the Ctrl key) and click the View Details button on the bottom of the window to open-up a new window with the list of users who’ve engaged with the selected Content Items.
Learning Report Tab
Go to this section to see the Learning Path enrollments by publisher. You will see a graphic representing this information.
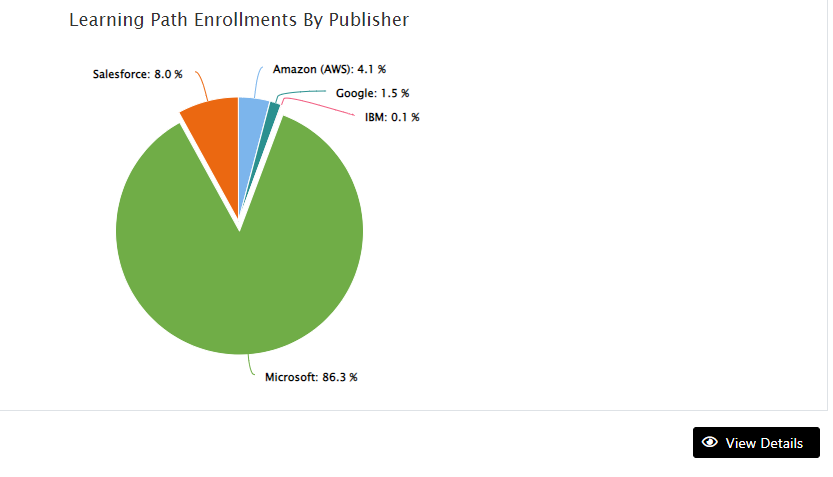
Click on the View Details button to open a new table that shows all Learning Paths with their Enrollments and Completions.
You can use the filters to search content by Publisher, Status or Learning Path’s Name, Description or Number. Click on the menu button next to the filter to export the data in an Excel or CSV format file.
Similar to the Geography section, you can then select one or multiple rows from the table (by holding the Ctrl key) and click the View Details button on the bottom of the window to open-up a new window with the list of users who’ve engaged with the selected Learning Path(s).