To navigate to the Campaign Dashboard of a specific campaign from the Manage Campaigns page, click on the “three dots” button of the campaign whose dashboard you want to see and select Campaign Dashboard.
Once you are in the Dashboard, you will see a panel and a graphic with different metrics.
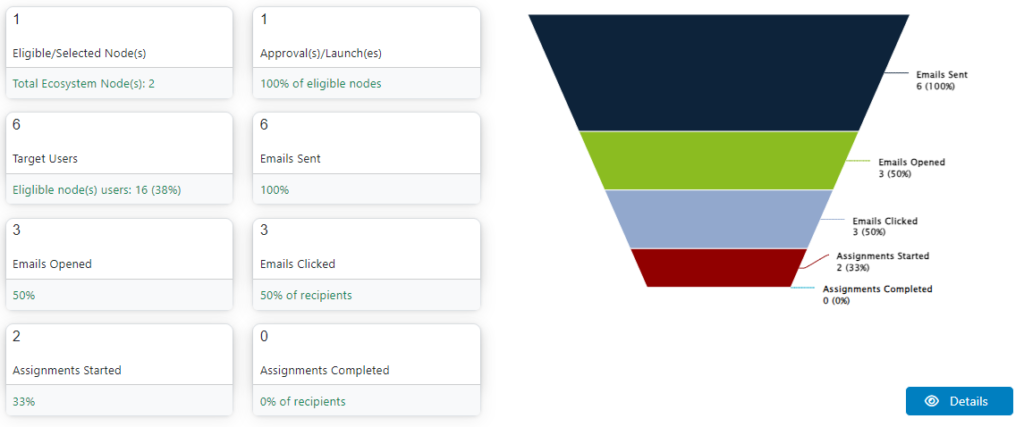
These statistics are:
- The total number of Selected Node(s) to which the campaign was sent.
- The total number of Approvals of the current Campaign.
- The total number of Target Users of the campaign which represents 100% of the audience.
- The total number of Emails Sent to the users and the percentage it represents.
- The total number of Emails Opened and the percentage it represents.
- The total number of Campaigns Clicked by the users and the percentage it represents.
- The total number of Assignments Started by the selected users.
- The total number of Assignments Completed by the selected users.
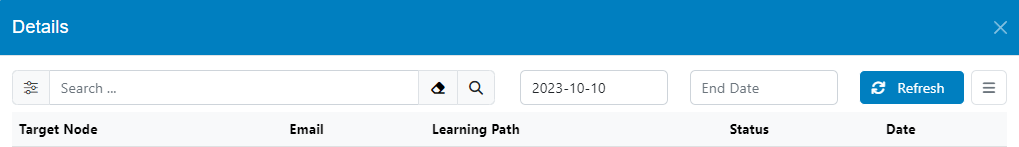
Below the graphic you will see the Details section where you can use filters like Date Range, Status, Asset Type (Content Items, Learning Paths, Bundles) to find specific information from the current campaign.
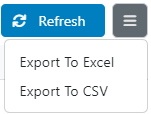
Use the Refresh button to update the table information according to the date range.
On the top right side, next to the Refresh button, you will find a small menú to export the information to Excel o CSV.